ExtraHop Bridge Triggers
published: 27th of February 2022
Intro
Recently, I was working with a customer that wanted to extract the TCP SYN unanswered in/out metric captured by Extrahop for a group of web servers, and send that data to Splunk for their application team to view in a Splunk dashboard.
It was an interesting problem to solve that highlights some of the programmability that is available on-box in the ExtraHop platform.
In this post, I will show you how to access Metrics via Bridge based Triggers within the ExtraHop platform and send that data to Splunk.
What Are Bridge Triggers Anyway?
To understand Bridge Triggers, first lets find out what a Trigger is.
ExtraHop exposes the trigger API that allows you to write on-box Javascript code to access, store, and visualise wire data events and metrics that are specific to your business requirements.
This data can be stored as custom metrics, used to build dashboards, and sent to external systems (such as Splunk) via Open Data Stream (ODS). It's really powerful stuff.
The main difference between a standard Trigger and a Bridge Trigger is that:
- Triggers execute on events during the wire data capture.
- Bridge Triggers execute when a Metric is computed and commited to the datastore.
Metric Catalog
To find the details of the Metric we are interested in we can search for it in the Metric Catalog. In my case I am looking for TCP - Unanswered SYNs In/Out. Lets browse to:
Now search for unanswered in the search box and select the TCP - Unanswered SYNs In Metric.
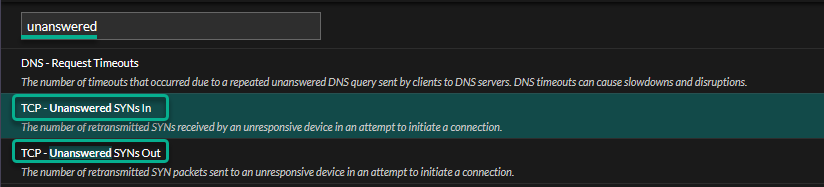
In the Edit Metric panel on the right, under the REST API Parameters, we can see the details we need to look for in the Trigger.
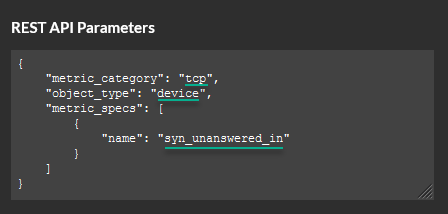
This tells me that I can find syn_unanswered_in in the object_type of device in the metric_category of tcp. Take note of this info, we will need it in a future step.
syn_unanswered_out also lives in the same object_type / metric_category.
Bridge Trigger
Now that we have the Metric information we need, lets create a Trigger. Browse to:
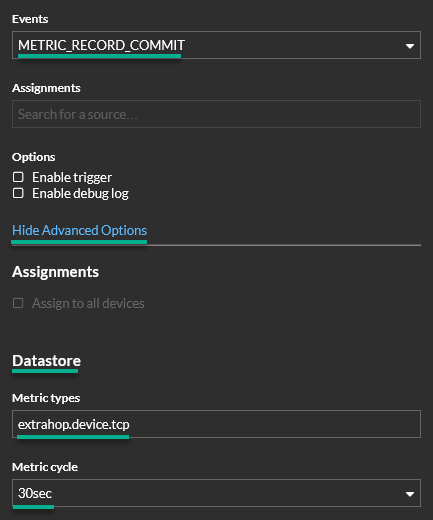
The Events type is METRIC_RECORD_COMMIT. Under Show Advanced Options, you will see that the Metric types are of the Datastore type.
Enter extrahop.device.tcp as the Metric Type which maps to the information we gathered earlier from the Metric Catalog. Also, set the Metric cycle to 30sec. The Metric cycle defines the time period in which the Metrics SUM is calculated and written to the datastore.
Trigger Code
Now for the fun part. Trigger are written in Javascript and have access to the exposed Trigger API.
I only want to collect the metrics for a subset of devices and send them off to Splunk. Bridge triggers cannot be assigned to a device group so, I will create an array; devicesOfInterest to hold the ID's of the devices I am interested in.
The device ID can be found under:
We want to capture the syn_unanswered_in/out fields which are stored on the MetricRecord.fields property. We know these are the fields we are looking for because we found that information in the Metric Catalog from a previous step.
The Trigger code below captures the data we are looking for and sends it off to Splunk. Follow along with the code comments for details.
// Array of devices to capture metrics for.
let devicesOfInterest = [
    "aabbcc1122330000", // Test server
    // ... The rest of the servers in the group
]
// MetricRecord.object.id is the ID that ExtraHop uses for a discovered device.
// Continue if "MetricRecord.object.id" is in our "devicesOfInterest" array.
if (devicesOfInterest.includes(MetricRecord.object.id)) {

    // Build a record that Splunk can parse that contains:
    //  - The server IP.
    //  - The total tcp_syn_unanswered_in/out events per time interval.
    let splunk_log = `\
extrahop_event=tcp_syn_unanswered \
server_ip=${MetricRecord.object.ipaddrs[0]} \
tcp_syn_unanswered_in=${MetricRecord.fields["syn_unanswered_in"]} \
tcp_syn_unanswered_out=${MetricRecord.fields["syn_unanswered_out"]}`
    // Send log message to Splunk with a log level of "info".
    Remote.Syslog("ods_splunk_target").info(splunk_log);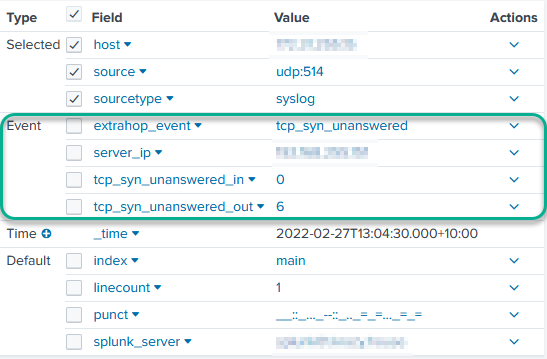
}And there you have it! In a few lines of code, we managed to capture the number of TCP SYN Unanswerd In/Outbound events for a group of hosts in a 30 second window, and send it off to Splunk via ODS as a Syslog formatted message.
To round this post out, feast your eyes on the Splunk log which contains the details sent from the ExtraHop Trigger and becomes indexed and searchable in Splunk which can also be used in dashboards.
Outro
In this post, I showed you how to utilise ExtraHop Bridge (Datastore) Triggers to capture Metric data and send the data off to Splunk as a syslog message via ODS.
Links
https://forums.extrahop.com/t/using-metricrecord-in-triggers/2639